This page gives a way to navigate my trip reports by year.
Adventure unfolded over time.
Interactive List by Year
This page pulls from the same complete listing of trip reports as my maps and region lists, just in a different organizational format. In the desktop version, you can filter by a chosen year and if you want further filter by a state/province and a season. (In the mobile version, you can filter just by year.)
The filter uses AND logic for the specified categories and OR logic for unspecified categories.
The date shown on the thumbnail represents the most recent trip report on the page, if the page represents multiple days of climbing.
The button below opens a table showing the number of days represented by my trip reports. Variables:
unique_page_count represents the number of unique trip report pages.
unique_date_count represents the number of days represented by the trip reports.
unique_date_count_YYYY represents the number of days in the corresponding state/province and year.
Selected trip reports are removed (Tib/Fib 2010-11, Knee Surgery 2020-21, Covid 2021, 7-Day Fast) since these don't fall into a State/Province category and they are also trip reports that span long periods of time and skew the data.
The second table is a transpose of the first table and shows totals per year instead of totals per state/province.
Below the tables are some graphs showing a visual breakdown of the number of days by state/province and year and month.
This table and graphs are based on SQL queries to all pages on my site. They may take awhile to load.
Climbing Partners by Year
Click here to see a list of all of my climbing partners from 1994 to present.
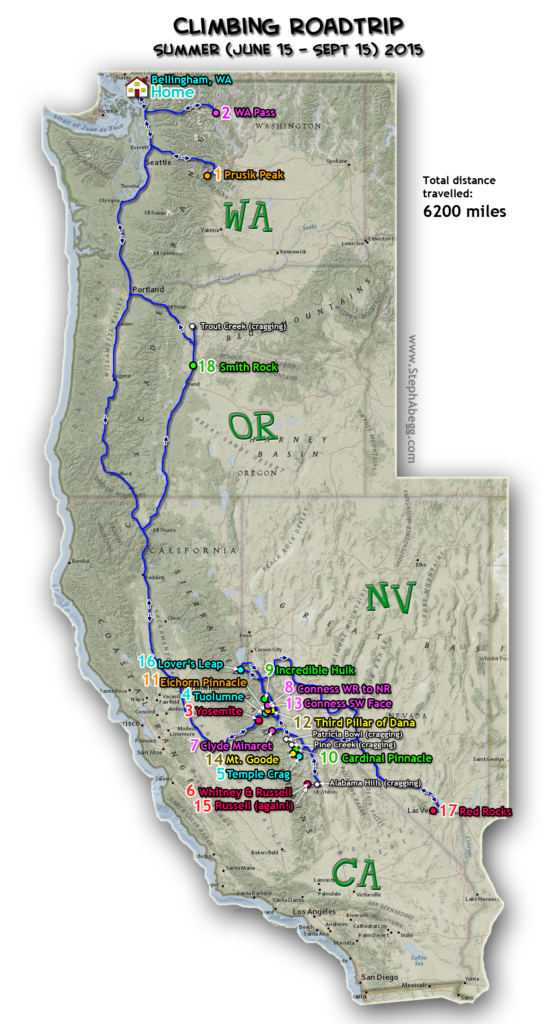
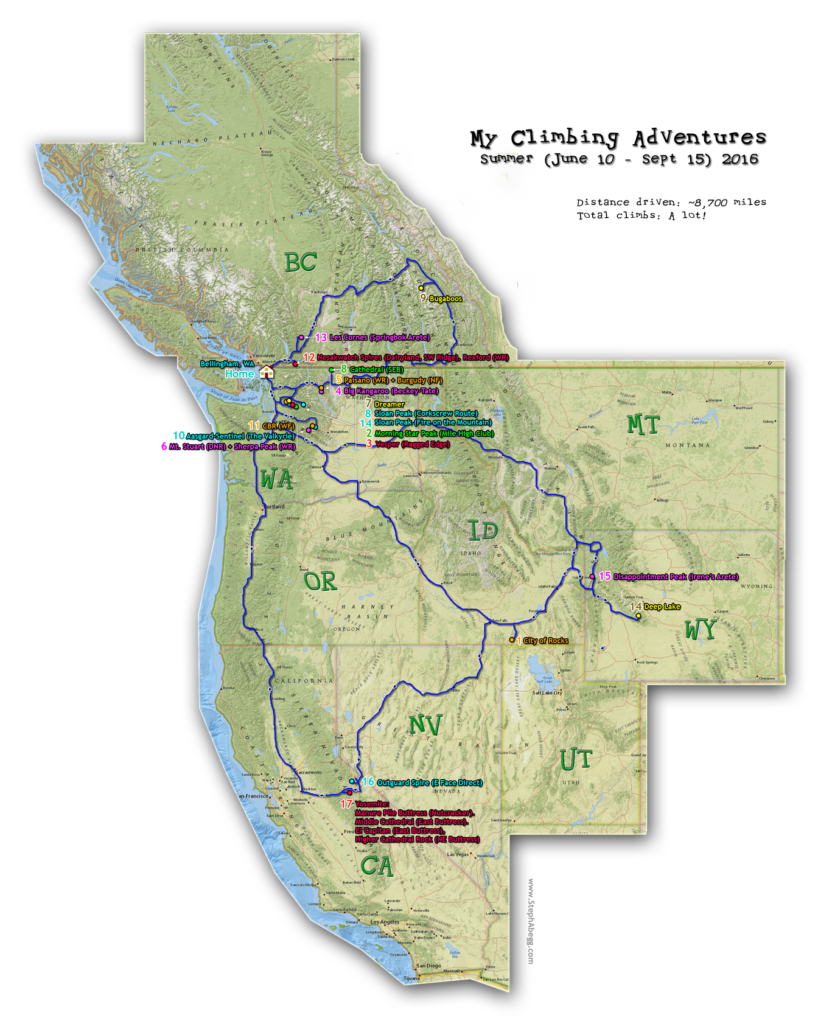
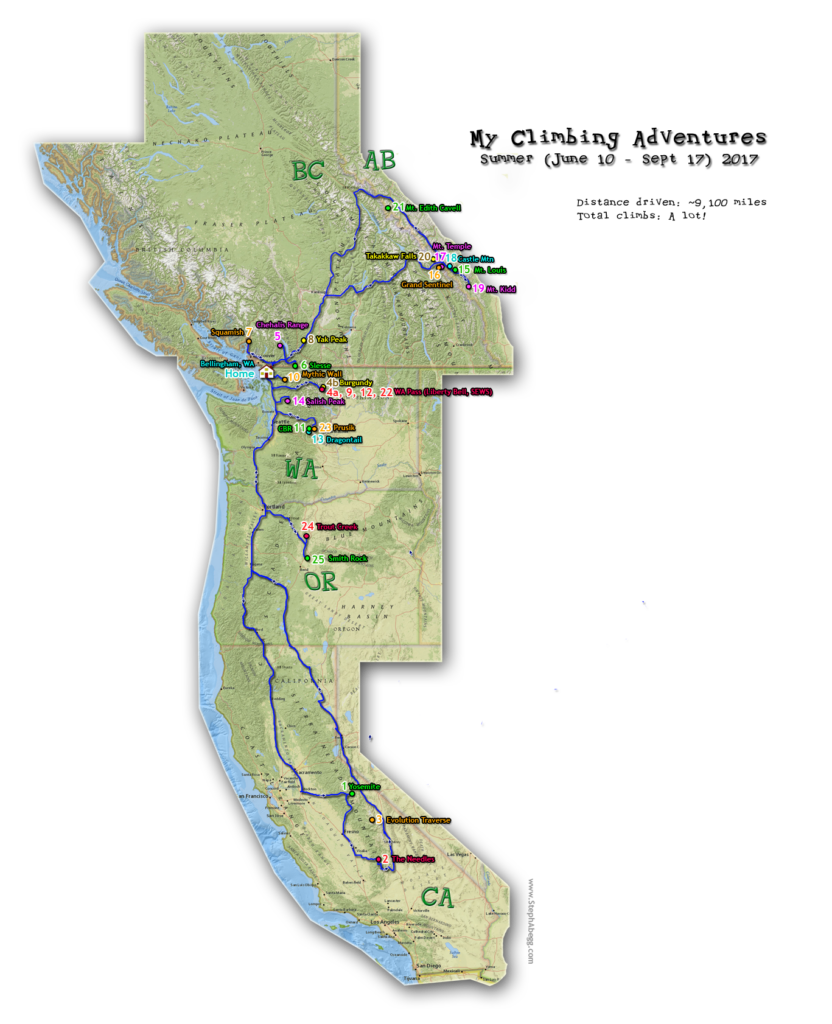
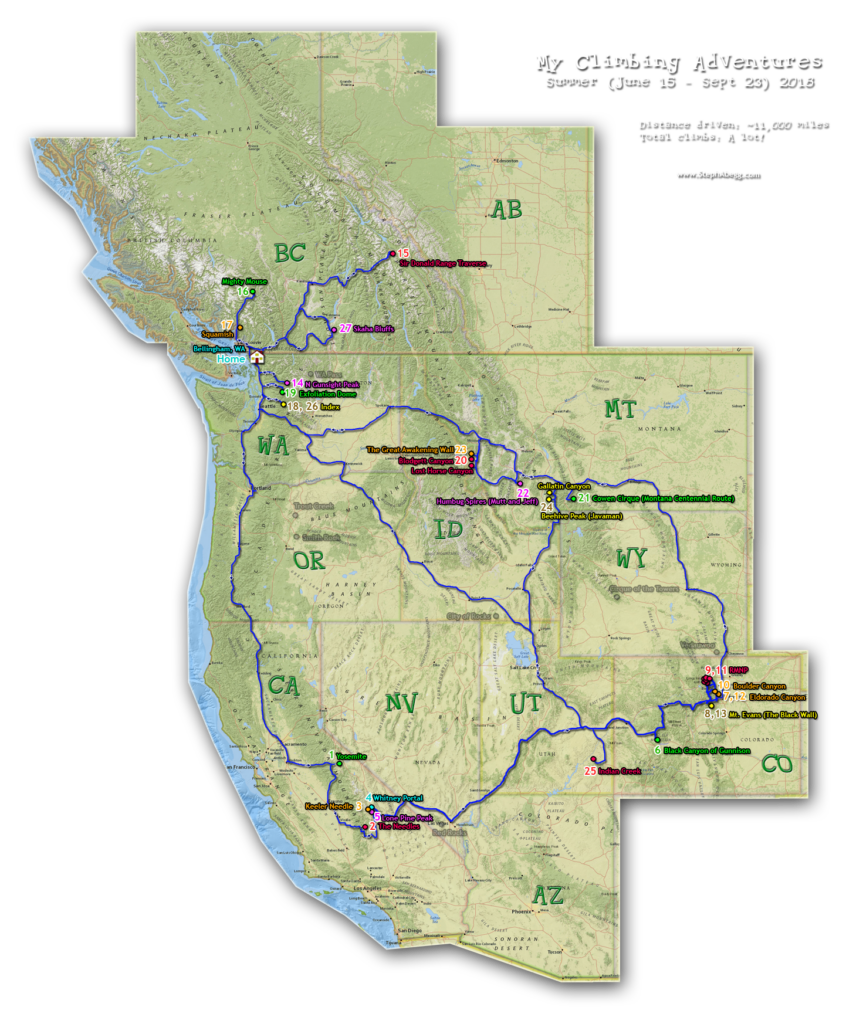
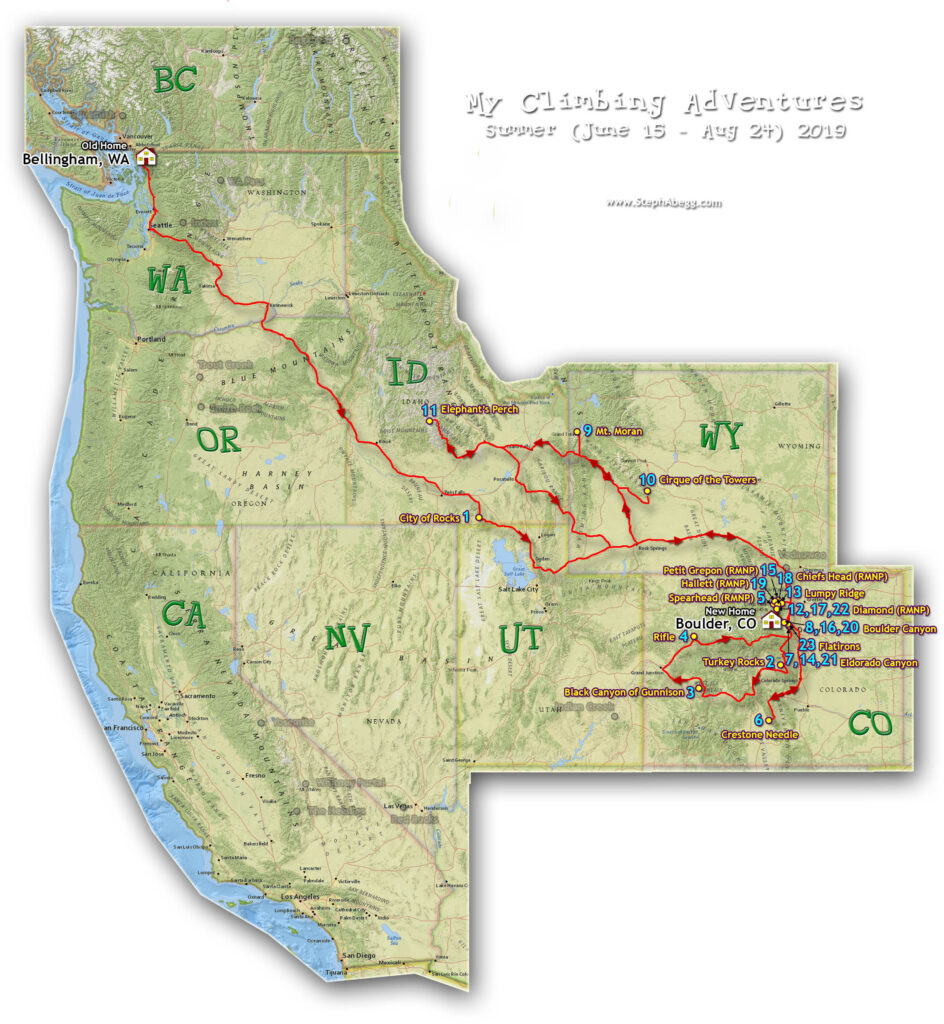
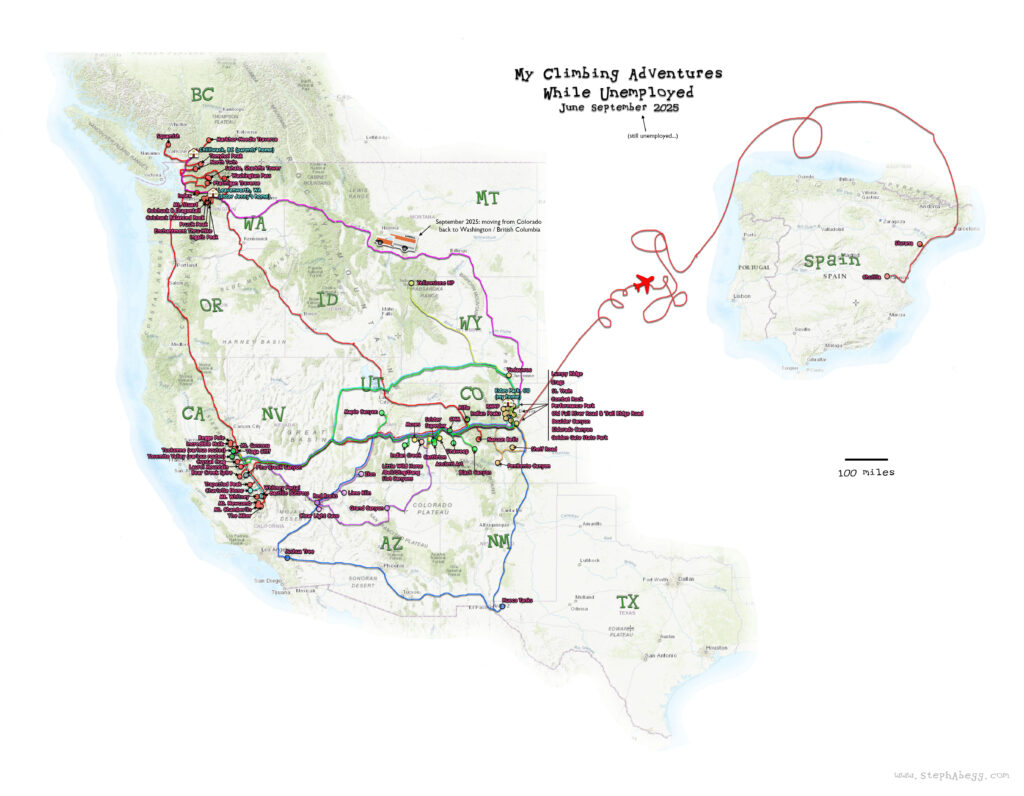
Some Summer Climbing Roadtrip Maps
CLICK TO ENLARGE
When I was a teacher (2014-2019), summers were for climbing roadtrips. Here are my 2014, 2015, 2016, 2017, 2018, 2019 roadtrip maps. I have embarked on other road trips in other years, but these were my primary roadtripping years.
First table: Table showing the number of days represented by my trip reports. Variables:
unique_page_count represents the number of unique trip report pages.
unique_date_count represents the number of days represented by the trip reports.
unique_date_count_YYYY represents the number of days in the corresponding state/province and year.
Selected trip reports are removed (Tib/Fib 2010-11, Knee Surgery 2020-21, Covid 2021, 7-Day Fast) since these don't fall into a State/Province category and they are also trip reports that span long periods of time and skew the data.
Second table: The second table is a transpose of the first table and shows totals per year instead of totals per state/province.
Graphs: Below the tables are some graphs showing a visual breakdown of the number of days by state/province and year and month.
This table and graphs are based on SQL queries to all pages on my site. They may take awhile to load.
Total Days Represented by my Trip Reports, by State/Province and Year (Row totals per State/Province)
state
unique_page_count
unique_date_count
unique_page_count_total_per_state
unique_date_count_total_per_state
unique_date_count_1994
unique_date_count_1998
unique_date_count_1999
unique_date_count_2001
unique_date_count_2002
unique_date_count_2003
unique_date_count_2004
unique_date_count_2005
unique_date_count_2006
unique_date_count_2007
unique_date_count_2008
unique_date_count_2009
unique_date_count_2010
unique_date_count_2011
unique_date_count_2012
unique_date_count_2013
unique_date_count_2014
unique_date_count_2015
unique_date_count_2016
unique_date_count_2017
unique_date_count_2018
unique_date_count_2019
unique_date_count_2020
unique_date_count_2021
unique_date_count_2022
unique_date_count_2023
unique_date_count_2024
unique_date_count_2025
Colorado
222
722
222
722
2
2
6
20
55
100
130
174
92
129
12
Washington
133
405
133
405
1
8
6
9
2
28
30
25
32
33
17
58
30
7
23
30
20
33
8
5
California
53
183
53
183
31
9
3
19
39
11
27
12
1
31
British Columbia
31
128
31
128
7
16
10
5
4
3
6
5
1
3
2
19
10
12
23
2
Wyoming
28
116
28
116
1
4
4
7
12
20
7
5
6
21
5
19
5
Arizona
10
69
10
69
4
6
12
15
15
14
1
2
Utah
14
68
14
68
21
14
3
4
7
1
13
5
Nevada
10
47
10
47
2
1
4
2
14
6
7
8
3
Idaho
4
41
4
41
10
12
4
15
Italy
2
36
2
36
33
3
Switzerland
3
29
3
29
15
14
Oregon
5
23
5
23
7
3
7
1
2
3
Spain
1
15
1
15
15
Texas
2
15
2
15
11
2
2
Montana
6
14
6
14
3
11
Alberta
10
13
10
13
1
3
2
7
North Carolina
1
6
1
6
6
Kentucky
1
4
1
4
4
South Dakota
1
4
1
4
4
state
unique_page_count
unique_date_count
unique_page_count_total_per_state
unique_date_count_total_per_state
unique_date_count_1994
unique_date_count_1998
unique_date_count_1999
unique_date_count_2001
unique_date_count_2002
unique_date_count_2003
unique_date_count_2004
unique_date_count_2005
unique_date_count_2006
unique_date_count_2007
unique_date_count_2008
unique_date_count_2009
unique_date_count_2010
unique_date_count_2011
unique_date_count_2012
unique_date_count_2013
unique_date_count_2014
unique_date_count_2015
unique_date_count_2016
unique_date_count_2017
unique_date_count_2018
unique_date_count_2019
unique_date_count_2020
unique_date_count_2021
unique_date_count_2022
unique_date_count_2023
unique_date_count_2024
unique_date_count_2025
∑ = 1
∑ = 10
∑ = 7
Total Days Represented by my Trip Reports, by State/Province and Year (Row totals per Year)